
You ever had the challenge that you want your users to have certain filters applied on dimensional columns before the measure evaluation in Power BI even starts?
I am facing this issue quite often at the moment. The challenge is that matrix or table visuals with the highest granularity possible are required to be shown to the user. If you are thinking about fact tables with millions of rows and you simply need to calculate several measures to display the data, even if those are simple SUM or MAX expressions, it is still taking a while and utilizes quite some resources. A heavy multiplier for this is the sheer amount of users having a look at this data, in my case approximately 20k a day.
After checking with the business owners, I figured out that most of the users have a filter applied on one specific column anyways, for example one or multiple yacht production years. However, in the meantime while the user is selecting the desired year in the filter, the Power BI engine is already calculating the measures for the entire dataset. Plus, making the report less interactive was no option to the business users, which is quite understandable. Having interactive reports is one reason for choosing Power BI, right?
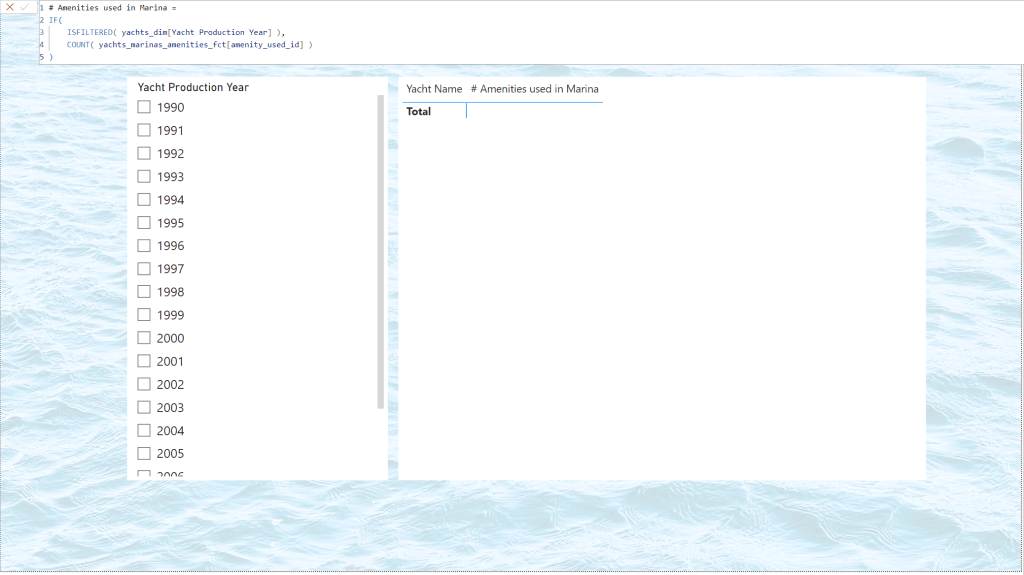
So why not giving our Power BI engine some peace and reduce the need of unnecessary computations? For this demonstration layout, our start situation in Power BI does not have a filter on one production year pre-applied and if it would, it would be fine for one use case, but for multiple others not.

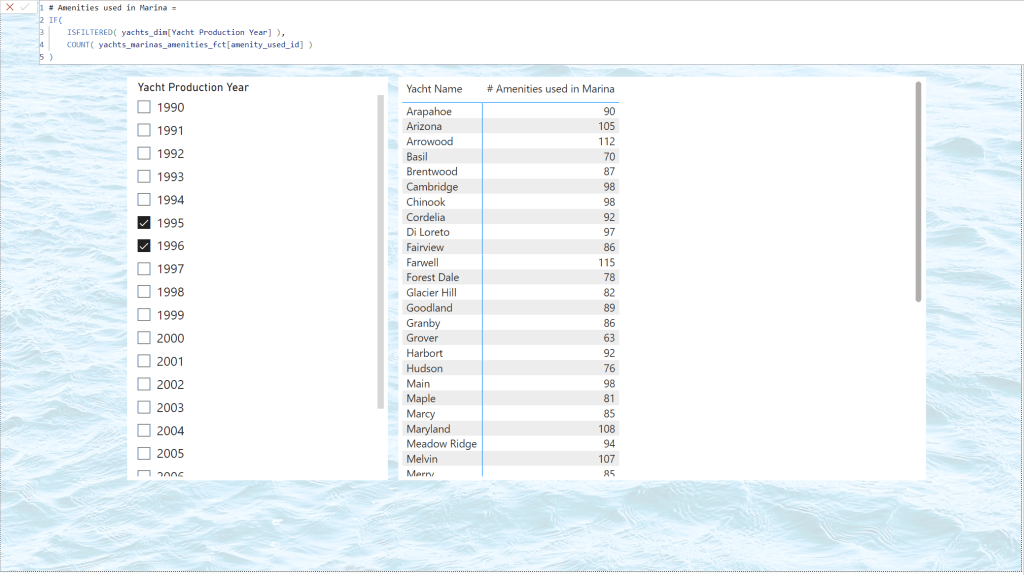
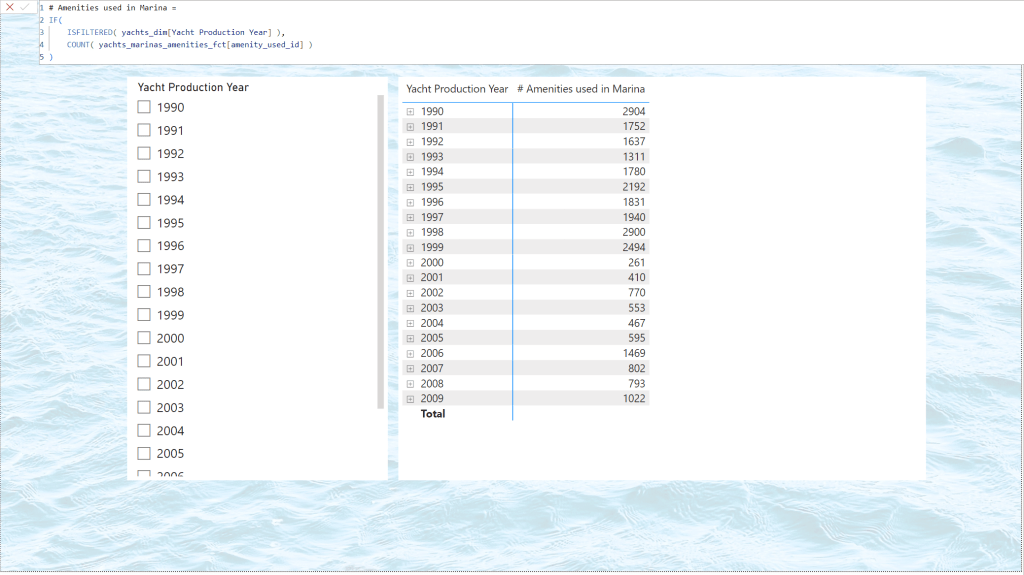
The solution – even from UX perspective may be not the best choice – was to come up with a condition to be met before the actual evaluation of the measure starts. To achieve that, I simply used the DAX function ISFILTERED and checked whether the specific dimensional column – in my case the yacht production year – is filtered by the user. This works perfectly fine until I pulled in the column into the matrix or table. Now, the row context kicked in. Meaning, as I have the information of the filtered year in the same row as my measure, the DAX engine says this column is filtered.
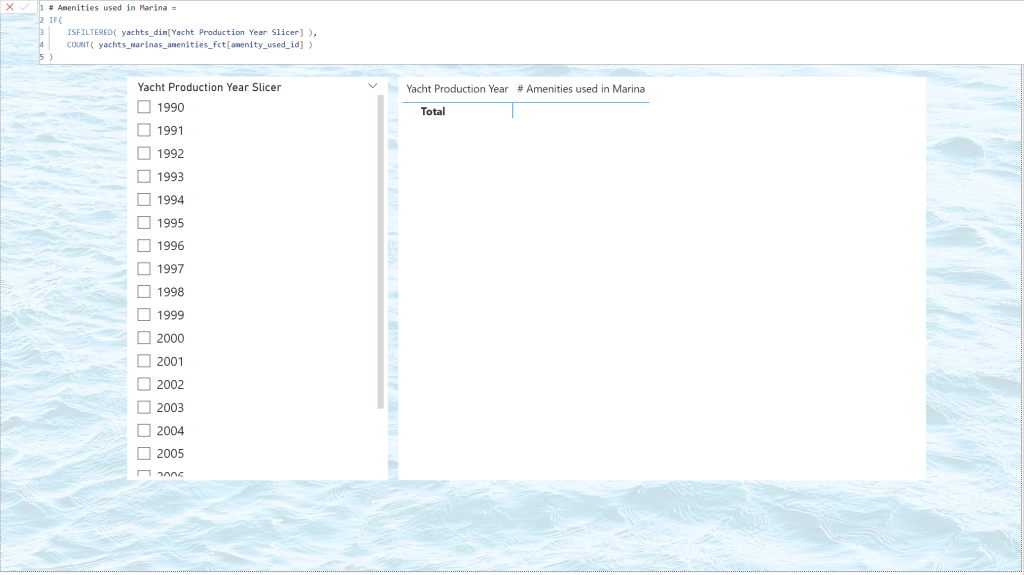
After several tries, I finally found what may be not the best solution in terms of model size, but it works like a charm. I duplicated the dimensional column I used for filtering (the production year) by using either a calculated column, leverage PowerQuery, or directly created it in the source. Then, I used this new column for my slicing and filtering activities. Finally, I adjusted the column reference for the ISFILTERED function by pointing to this newly duplicated column.
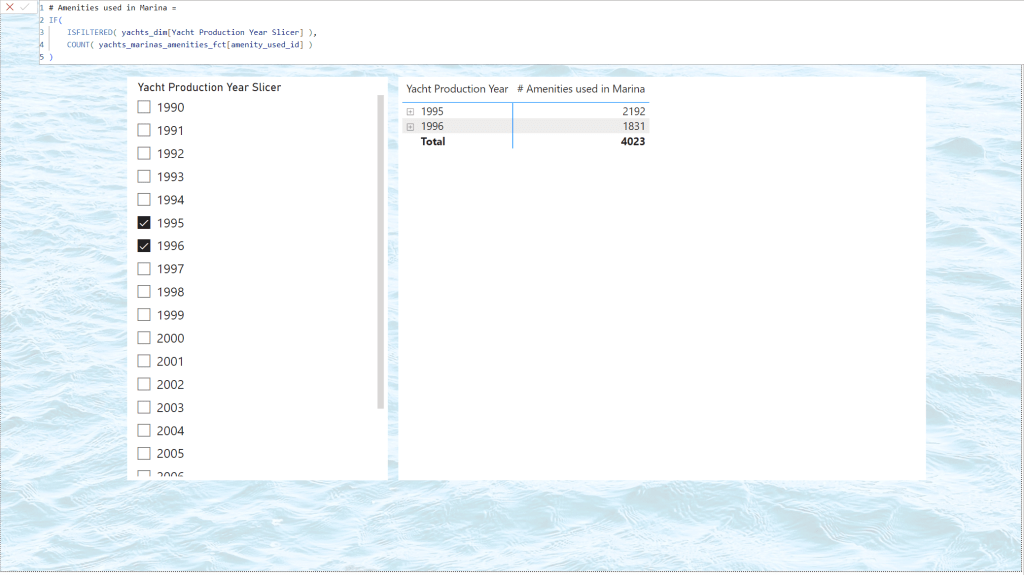
And that’s it! The combination of a simple IF check combined with the ISFILTERED function works pretty fine and prevents loading too much data and reduces the compute unit usage in Power BI.
Advancing this solution would be for example by providing a proper error message on the canvas, utilizing the ELSE clause of the IF statement returning a message using the ERROR function or something else. But this may be something for another blog post. 😉


Leave a comment