
In my previous blog post, I mentioned the possibility of showing custom error messages to the report user in case they did not apply the mandatory filters. In fact, you could think of any use case where you would like to show error messages to the user to guide them in order to get the desired results, but here I will focus on this use case.
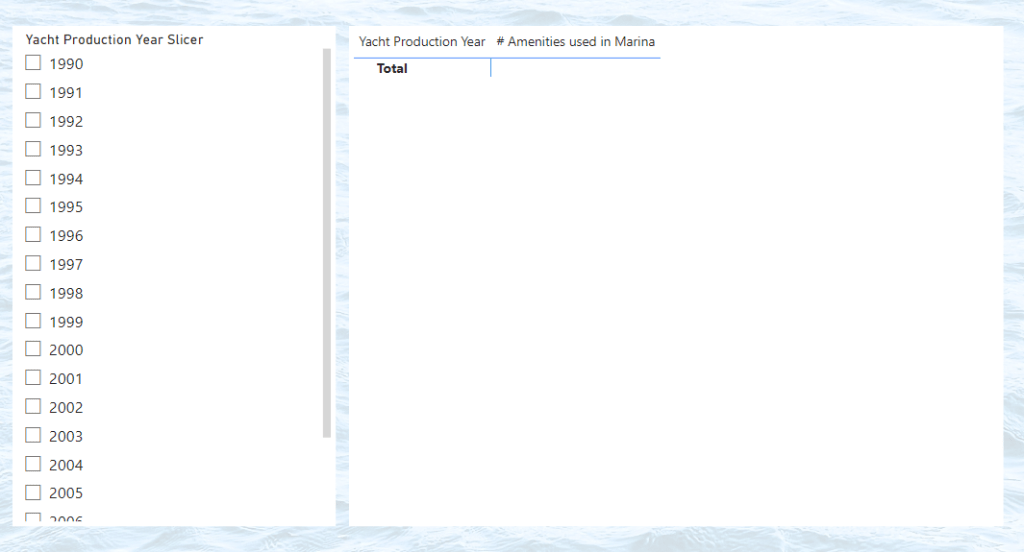
Coming back to the example of having the mandatory filter applied on the yacht’s production year, you might want to guide your users in case they have no filter applied. In the current setup, the measure simply shows blanks, and in our case – in a matrix visual, no rows at all.
Now, we got basically two option we could choose from. First, we could show an error message coming directly out of our measure using the ELSE condition. Second, we could use a custom visual element on the canvas and display some text in case the conditions are not met.
Using the ERROR function
Let’s start with the easy approach, using the ELSE condition. Currently, there is no ELSE condition utilized. Whenever the condition is not met, the measure is not computing anything. The formula engine basically stops the evaluation and utilizes BLANKs as we can see in the matrix visual.

A possibility to show the user why there are no values displayed, we could make use of the ERROR DAX function. We simply add it in our ELSE condition of the measure with a desired error message. The matrix visual then displays an error and shows our custom message.

When clicking on See details, we can see our custom message.

Make use of visual elements on the canvas
The second option is a bit more sophisticated, and, in my opinion, shows a more integrated user experience. Here, we make use of another custom measure and show the error message in a visual on the canvas whenever the filter condition is not met.
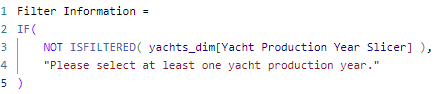
We simply create a shape of our choice, for example a rectangle. This rectangle can be formatted with whatever properties we prefer, I usually keep it 100% transparent so that it is not visible by default. In the Text setting below the Style properties, I select the custom measure Filter Information, I have created. The measure is rather simple and is basically the opposite of our condition that needs to be met in order to calculate the values in our matrix visual.

And that’s it! As you can see, the custom error message get’s displayed now. Whenever we have the required filters applied, the message will disappear and the user can make use of our report.


Leave a comment